As November 2021 draws to a close, there’s one thing that crypto market data can tell us in confidence; crypto retail investors can be a dramatic bunch.
The pullback in traditional markets resulting from the new Covid variant making its way into the media has played a big part in driving the current crypto market dip. But rather than seeing this as a healthy correction and a prime buy-in opportunity, general crypto market sentiment took a nosedive over the weekend, with the fear and greed index flashing ‘extreme fear’.
If you’re taking a long-term approach to grow your crypto portfolio, as you should be, there is more than enough data to support the idea that fears surrounding the current dip have been wildly exaggerated. Not only is this dip just another phase in a predictable crypto price cycle, but it has also shown the extent to which large-cap altcoins have decoupled from Bitcoin’s price movements. This is great news for investors who have been patiently waiting for signs of an alt season to start and for anyone interested in buying into Bitcoin at a discount. Let’s gain some perspective on what has happened and make an educated guess as to where we’ll go from here.
What evidence is there to suggest that prices will move back up?
While no investment is without risk, the variety and quality of information that our data-driven world has to offer has made investing in volatile assets far less intimidating than it once was, provided that you focus on a long-term investment strategy.
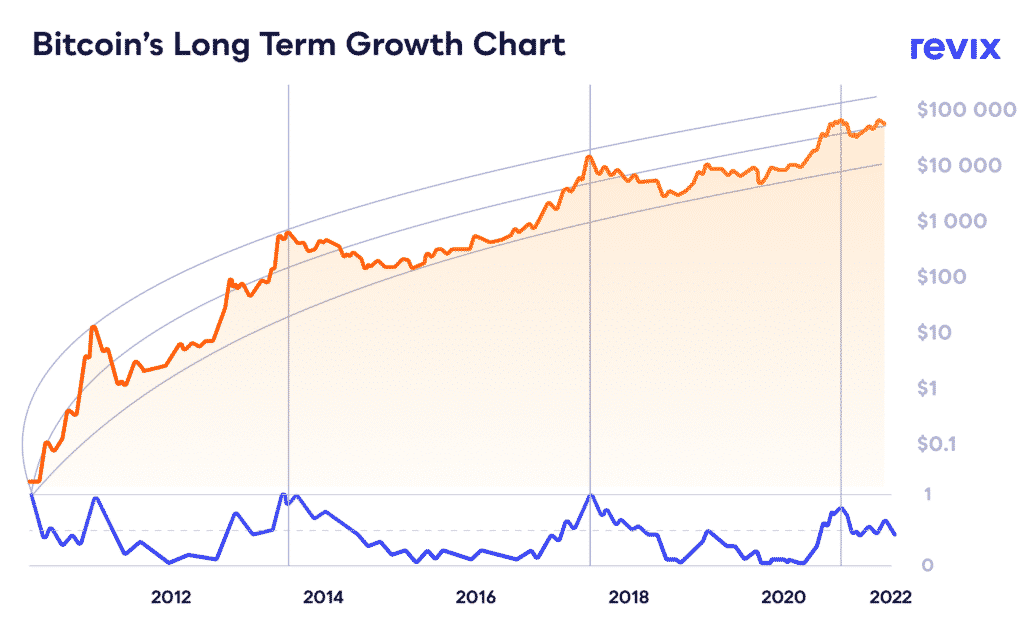
While there are numerous valuable metrics, graphs and indicators available to long-term investors, one of the most popular is called a log graph.
The log graph makes it much easier to understand and contextualise price movements over an extended timeframe. Explaining logarithmic graphs is outside the scope of this article, but this video explains the concept nicely.
Log graphs also make it significantly easier to spot patterns in an asset’s price movements, which happens to be super handy in suggesting where Bitcoin’s price is likely to go from here.


Looking at Bitcoin’s logarithmic chart in a timeframe between 2012 and 2022 reveals a pattern that you don’t need to be a financial analyst to spot. If Bitcoin’s price follows the same pattern it has since 2012, we’re only halfway to the upper end of the growth chart, which sits at over $100 000. We’ll let you do the maths on what that would mean for investors who see this pullback as an opportunity.
What is an alt season, and why should I care?
One thing that is markedly different about this most recent dip is the extent to which the prices of large-cap altcoins have moved independently of Bitcoin. They have also started to recover faster than Bitcoin. In the past, large-cap altcoin price movements have been near indistinguishable from Bitcoin’s during a market dip, but this time around, things are different.
Usually, when Bitcoin pulls back, altcoins usually follow suit with a greater pullback. This time, when Bitcoin fell by 22.30% from its all-time high, Ethereum only fell by roughly 19%. This is all great news for altcoin holders, but what does it have to do with an alt season? Sure, Bitcoin’s price movements are still reflected in these altcoin’s price charts, but the reduction of Bitcoin’s influence is big enough this time around to be noticeable.
This could be an indicator of an incoming alt season that may be markedly different from any that have come before it. An alt season is the crypto term for a period where alternative coins outperform Bitcoin, thereby presenting a far wider range of investment opportunities than a focussed Bitcoin rally.
While large-cap altcoins’ independence from Bitcoin’s price movements isn’t enough to confirm that alt season is on, there are multiple other metrics that suggest it may be.


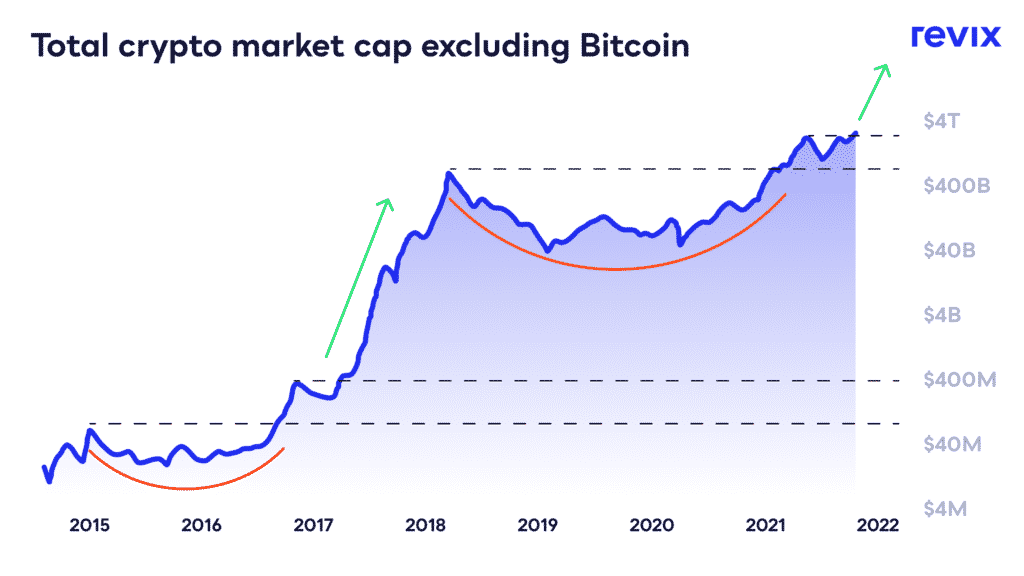
Another chart that’s showing a possible alt season is on its way is the Total crypto market cap excluding Bitcoin. In other words, the line shows the value of all altcoins combined over time.
Notice the repeating pattern highlighted with the red curves and green arrows? There are clear similarities between the two periods in question, namely 2014-2018 and 2018-present.
The 2014-2018 period shows an accumulation phase (red curves), followed by an alt season (2017 green arrow). The graph shows us that a similar accumulation phase has taken place in the 2018-2021 period. That puts us squarely in the same stage of the crypto price cycle as we were when the 2017 alt season kicked off.
If the pattern continues to follow the shape laid out in 2014-2018, then it could mean that this is only the beginning of yet another alt season.
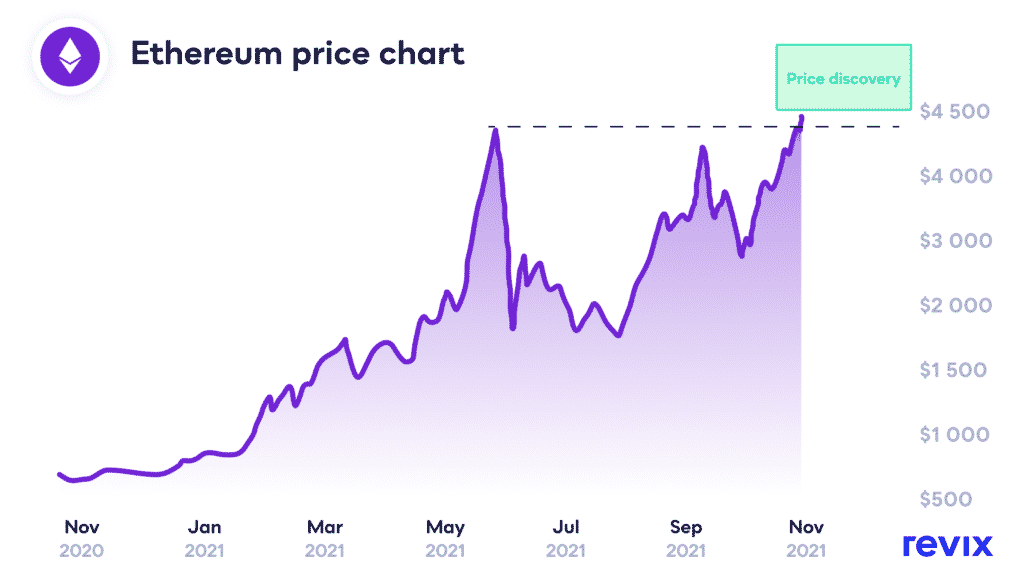
Alt seasons generally need a catalyst, and historically, an ETH breakout is just the thing. So how far away are we from ETH’s next breakout? If a picture is worth a thousand words, the graph below may just be priceless.


At the time of writing, ETH’s price is just $500 shy of its all-time high. Once it breaks above that point, it’s anyone’s guess how high it will climb. Still feel like the crypto market is crashing?
Buy the dip?
In summation, there is significant evidence to support the idea that this pullback may just be one of the best buy-in opportunities that crypto investors are likely to see for many months to come.
Today, 30th of November, is the last day of Revix’s Black November fee-free promotion. Investors get 100% off all buy-in fees, valid for every product on the Revix platform.


Revix is a Cape Town-based crypto investment platform which makes it safer and simpler to invest in crypto than ever before. Not only can you buy individual cryptoassets, including BTC, ETH, SOL, DOT and BNB. Also, Revix offers Crypto Bundles, which allow you to buy into an instant diversified crypto portfolio. Perfect for investors who are new to crypto.

